Visualizing Data
Certain ADIOS2 bp files can be recognized by third party visualization tools. This section describes how to create an ADIOS2 bp file to accomodate the visualization product requirements.
Using VTK and Paraview
ADIOS BP files can now be seamlessly integrated into the Visualization Toolkit and Paraview.
Datasets can be described with an additional attribute that conforms to the VTK XML data model formats as high-level descriptors that will allow interpretation of ADIOS2 variables into a hierarchy understood by the VTK infrastructure.
This XML data format is saved in ADIOS2 as either an attribute or as an additional vtk.xml file inside the file.bp.dir directory.
There are currently a number of limitations:
It only works with MPI builds of VTK and Paraview
Support only one block per ADIOS dataset
Only supports BP Files, streams are not supported
Currently working up to 3D (and linearized 1D) variables for scalars and vectors.
Image Data, vti, is supported with ADIOS2 Global Array Variables only
Unstructured Grid, vtu, is supported with ADIOS2 Local Arrays Variables only
Two VTK file types are supported:
Image data (.vti)
Unstructured Grid (.vtu)
The main idea is to populate the above XML format contents describing the extent and the data arrays with ADIOS variables in the BP data set. The result is a more-than-compact typical VTK data file since extra information about the variable, such as dimensions and type, as they already exist in the BP data set.
A typical VTK image data XML descriptor (.vti):
<?xml version="1.0"?>
<VTKFile type="ImageData">
  <ImageData WholeExtent="x1 x2 y1 y2 z1 z2" Origin="x0 y0 z0" Spacing="dx dy dz">
    <Piece Extent="x1 x2 y1 y2 z1 z2">
      <PointData>
        <DataArray Name="p1"/>
        <DataArray Name="p2"/>
      </PointData>
      <CellData>
        <DataArray Name="c1"/>
        <DataArray Name="c2"/>
      </CellData>
    </Piece>
  </ImageData>
</VTKFile>
A typical VTK unstructured grid XML descriptor (.vtu):
<?xml version="1.0"?>
<VTKFile type="ImageData">
  <ImageData WholeExtent="x1 x2 y1 y2 z1 z2" Origin="x0 y0 z0" Spacing="dx dy dz">
    <Piece Extent="x1 x2 y1 y2 z1 z2">
      <PointData>
        <DataArray Name="p1"/>
        <DataArray Name="p2"/>
      </PointData>
      <CellData>
        <DataArray Name="c1"/>
        <DataArray Name="c2"/>
      </CellData>
    </Piece>
  </ImageData>
</VTKFile>
In addition, VTK can interpret physical-time or output-step varying data stored with ADIOS by reusing the special “TIME” tag. This is better illustrated in the following section.
Saving the vtk.xml data model
For the full source code of the following illustration example see the gray-scott adios2 tutorial.
To incorporate the data model in a BP data file, the application has two options:
Adding a string attribute called “vtk.xml” in code. “TIME” is a special tag for adding physical time variables.
const std::string imageData = R"(
     <?xml version="1.0"?>
     <VTKFile type="ImageData" version="0.1" byte_order="LittleEndian">
       <ImageData WholeExtent=")" + extent + R"(" Origin="0 0 0" Spacing="1 1 1">
         <Piece Extent=")" + extent + R"(">
           <CellData Scalars="U">
               <DataArray Name="U" />
               <DataArray Name="V" />
               <DataArray Name="TIME">
                 step
               </DataArray>
           </CellData>
         </Piece>
       </ImageData>
     </VTKFile>)";

io.DefineAttribute<std::string>("vtk.xml", imageData);
Tip
C++11 users should take advantage C++11 string literals (R"( xml_here )") to simplify escaping characters in the XML.
The resulting bpls output should contain the “vtk.xml” attribute and the variables in the model:
> bpls gs.bp -lav
File info:
  of variables:  3
  of attributes: 7
  statistics:    Min / Max

  double   Du       attr   = 0.2
  double   Dv       attr   = 0.1
  double   F        attr   = 0.02
  double   U        24*{48, 48, 48} = 0.107439 / 1.04324
  double   V        24*{48, 48, 48} = 0 / 0.672232
  double   dt       attr   = 1
  double   k        attr   = 0.048
  double   noise    attr   = 0.01
  int32_t  step     24*scalar = 0 / 575
  string   vtk.xml  attr   =
<VTKFile type="ImageData" version="0.1" byte_order="LittleEndian">
  <ImageData WholeExtent="0 49 0 49 0 49" Origin="0 0 0" Spacing="1 1 1">
    <Piece Extent="0 49 0 49 0 49">
      <CellData Scalars="U">
        <DataArray Name="U" />
        <DataArray Name="V" />
        <DataArray Name="TIME">
          step
        </DataArray>
      </CellData>
    </Piece>
  </ImageData>
</VTKFile>
Saving a “vtk.xml” file inside the file.bp.dir to describe the data after is created
> cat gs.bp.dir/vtk.xml

  <?xml version="1.0"?>
  <VTKFile type="ImageData" version="0.1" byte_order="LittleEndian">
    <ImageData WholeExtent=")" + extent + R"(" Origin="0 0 0" Spacing="1 1 1">
      <Piece Extent=")" + extent + R"(">
        <CellData Scalars="U">
          <DataArray Name="U" />
          <DataArray Name="V" />
          <DataArray Name="TIME">
            step
          </DataArray>
        </CellData>
      </Piece>
    </ImageData>
  </VTKFile>
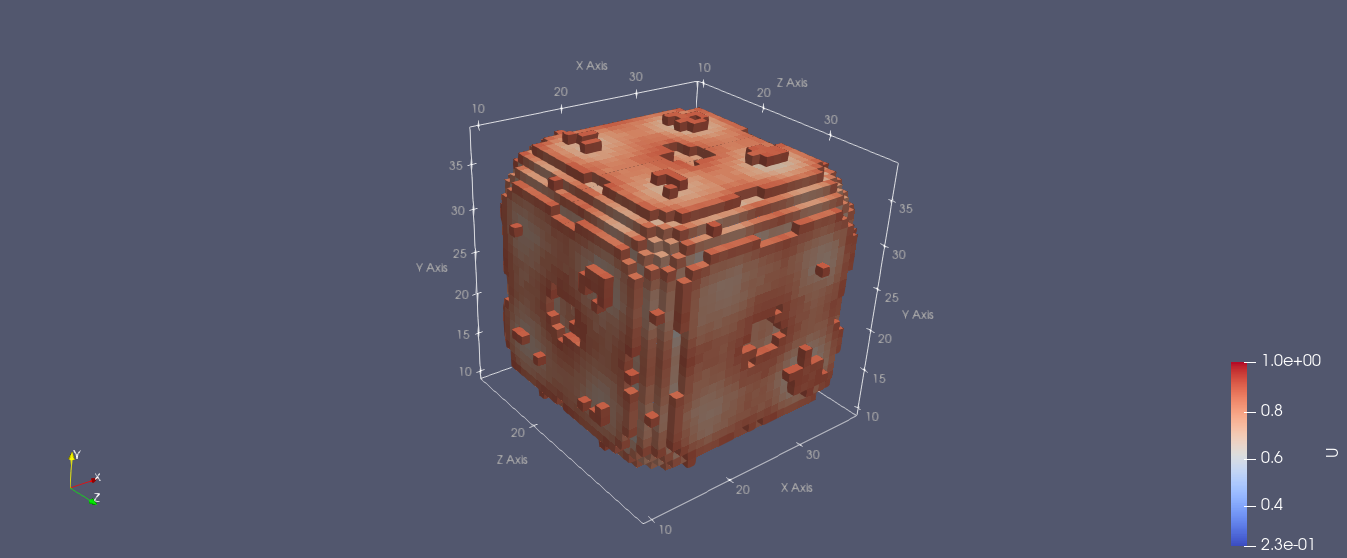
This BP file should be recognize by Paraview:
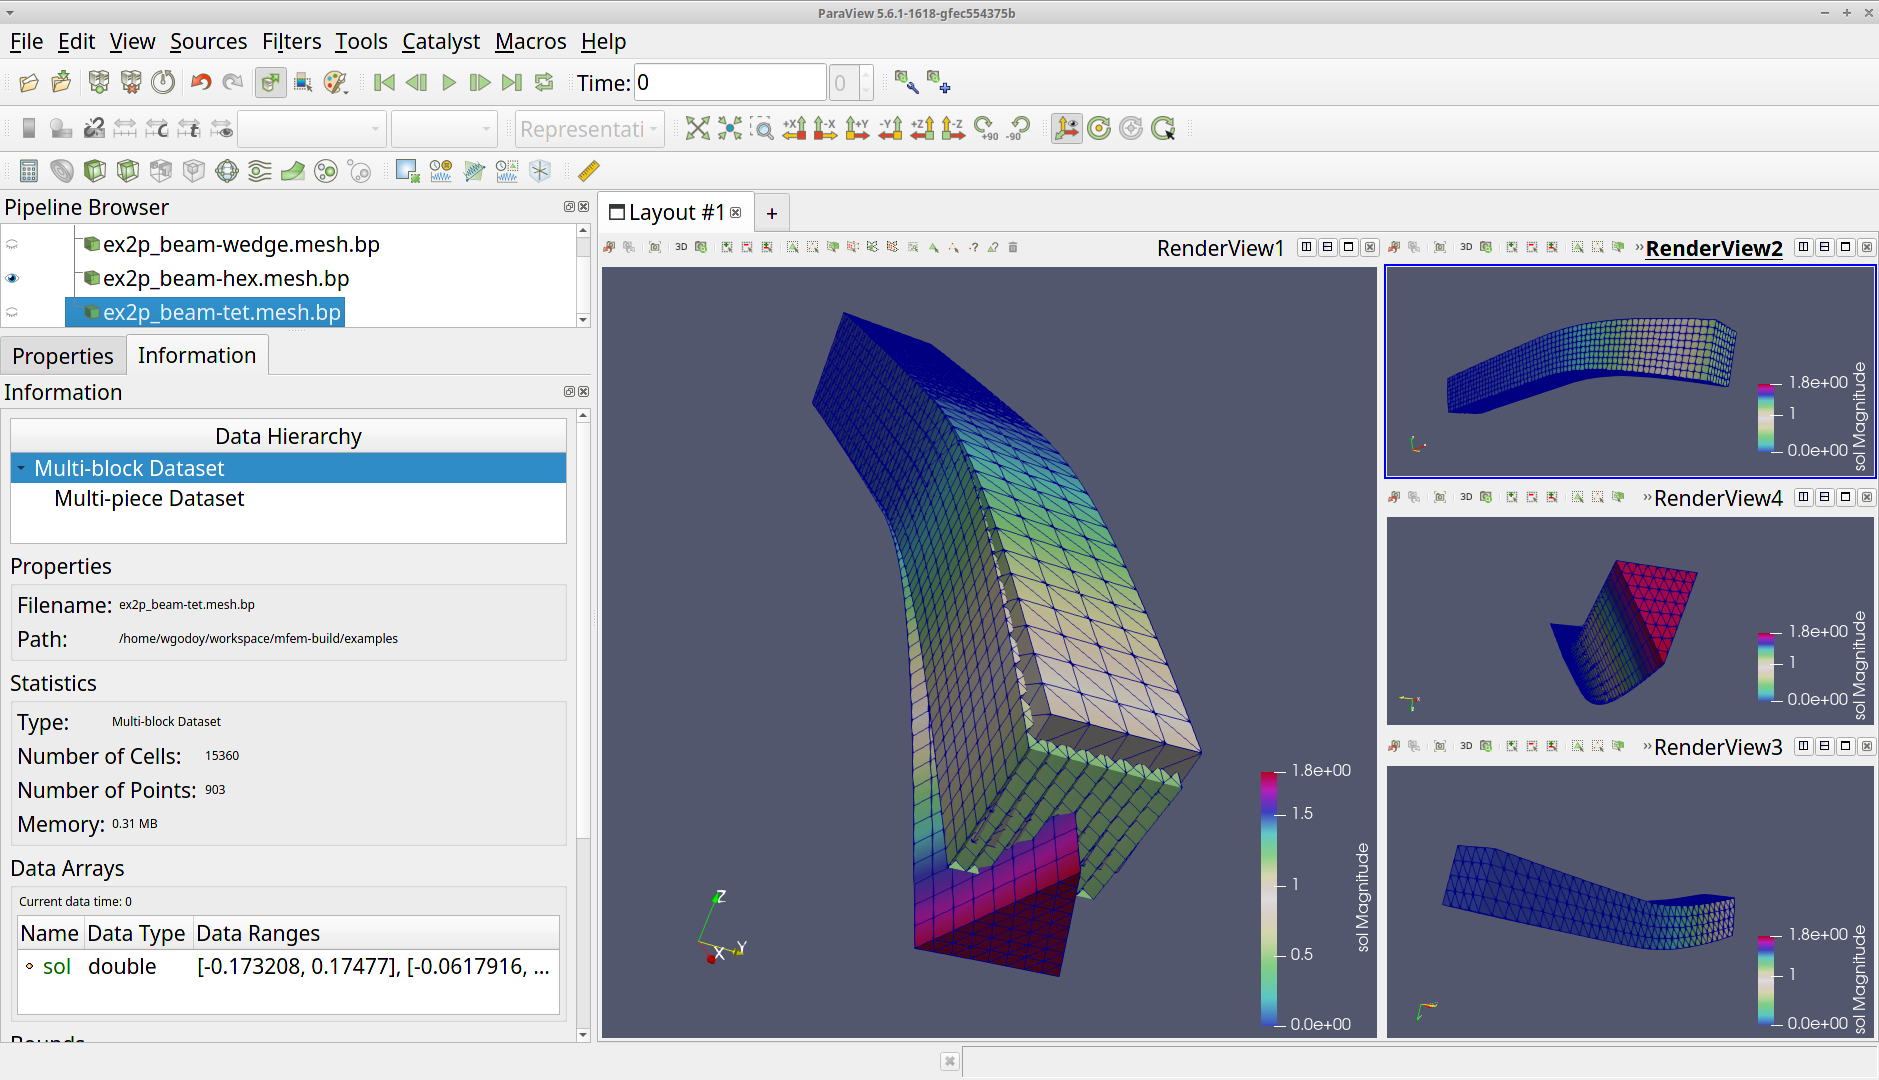
Similarly, unstructured grid (.vtu) support can be added with the limitations of using specific labels for the variable names setting the “connectivity”, “vertices”, and cell “types”.
The following example is taken from example 2 of the MFEM product examples website using ADIOS2:
The resulting bpls output for unstructured grid data types:
File info:
  of variables:  6
  of attributes: 4
  statistics:    Min / Max

  uint32_t  NumOfElements       {4} = 1024 / 1024
  uint32_t  NumOfVertices       {4} = 1377 / 1377
  string    app                 attr   = "MFEM"
  uint64_t  connectivity        [4]*{1024, 9} = 0 / 1376
  uint32_t  dimension           attr   = 3
  string    glvis_mesh_version  attr   = "1.0"
  double    sol                 [4]*{1377, 3} = -0.201717 / 1.19304
  uint32_t  types               scalar = 11
  double    vertices            [4]*{1377, 3} = -1.19304 / 8.20172
  string    vtk.xml             attr   =
<VTKFile type="UnstructuredGrid" version="0.1" byte_order="LittleEndian">
  <UnstructuredGrid>
    <Piece NumberOfPoints="NumOfVertices" NumberOfCells="NumOfElements">
      <Points>
        <DataArray Name="vertices" />
      </Points>
      <Cells>
        <DataArray Name="connectivity" />
        <DataArray Name="types" />
      </Cells>
      <PointData>
        <DataArray Name="sol" />
      </PointData>
    </Piece>
  </UnstructuredGrid>
</VTKFile>
and resulting visualization in Paraview for different “cell” types: